
Have you ever thought about starting up a restaurant business at your place of choosing? Maybe you love your cultural food a lot but it’s not present in the city you currently reside in?
Sure, the food itself you bring to the customer’s table has to taste great. However, The best idea is to optimize every step you take before the restaurant even starts. Let’s go step by step and look at the optimization points:
-
Food and restaurant type
-
The location strategy.
-
Daily/Annual/Monthly Expenses.
All of these are equally important, however just to get started it is important to have an answer to some specific questions. What kind of food am I serving? What is my target audience and what is the best location? How much am I willing to spend on rent?
Sounds like some good steps to get started right? So let’s answer those questions step by step with an example of some code (fun.)
So for this example, the restaurant I am choosing to go with is a fast-food Greek restaurant in Los Angeles.
Motivation
Recent Demographic surveys have shown that the Los Angeles Metropolitan area is. One of the most densely packed regions in the world. Interestingly due to its popularity, it is also one of the most culturally diverse. With a high number of tourists from all over the world landing at Los Angeles International Airport (LAX) along with the growing number of settlements in the region. Throughout the years we have seen a strong increase in ethnic food in the county itself which correlates with the increase in a diverse population. Studies from the past years have shown that even though the rise in ethnic food is increasing. There is also a disparity in the types of ethnic food [1]. This project aims to introduce a planned method to introduce a Greek restaurant in the Los Angeles County area.
Data and Resources:
To achieve our target, we use the following sources and services:
-
BeautifulSoup: This Wikipedia page will be the source of identifying all the neighborhoods that exist in the Los Angeles area: List of Districts and Neighborhoods of Los Angeles[1]
-
GeoPy: We will be using GeoPy to map our neighborhoods. This API allows us to locate the precise coordinates of a location using numerous data sources.
-
Folium: To map our coordinates on a map that can be visualized, we will be using the folium API.
-
Foursquare API: The Foursquare API [2] gives us access to the most popular locations in a given area. Using the above-mentioned services and the API we can pin-point the restaurant demographics in the Neighborhood.
-
Rent Data: Los Angeles Rent Prices[3]
Methodology
The first step is scrapping web data to get a list of all the neighborhoods in Los Angeles. Fortunately, I was able to find a listed Wikipedia page.
url = requests.get('https://en.wikipedia.org/wiki/List_of_districts_and_neighbourhoods_of_Los_Angeles').text
soup = BeautifulSoup(url,"html.parser")

lis = []
for li in soup.findAll('li'):
    if li.find(href="/wiki/Portal:Los_Angeles"):
        break
    if li.find(href=re.compile("^/wiki/")):
        lis.append(li)
    if li.text=='Pico Robertson[34]': #Pico Robertson is the only item on the list that does not have a hyperlink reference
        lis.append(li)


neigh = []
for i in range(0,len(lis)):
    neigh.append(lis[i].text.strip())

df = pd.DataFrame(neigh)
df.columns = ['Neighbourhood']
GeoLocation
Although, we have a list of the neighborhoods. They aren’t since they are simple strings with no real value. Now, we will match the Neighborhoods with their correct longitude and latitude signals using GeoPy Nominatim Locator
# define the data frame columns
column_names = ['Neighbourhood', 'Latitude', 'Longitude']

# instantiate the data frame
nhoods = pd.DataFrame(columns=column_names)

geolocator = Nominatim(user_agent="la_explorer",timeout=5)
for i in range(0,len(df)):

    address = df.Neighbourhood[i]+', Los Angeles'
    location = geolocator.geocode(address)
    if location == None:
        latitude = 0
        longitude = 0
    else:
        latitude = location.latitude
        longitude = location.longitude

    nhoods = nhoods.append({'Neighbourhood': df.Neighbourhood[i],
                                              'Latitude': latitude,
                                              'Longitude': longitude}, ignore_index=True)


nhoods['Latitude']=nhoods['Latitude'].astype(float)
nhoods['Longitude']=nhoods['Longitude'].astype(float)

nhoods=nhoods[(nhoods.Latitude>33.5) & (nhoods.Latitude<34.4) & (nhoods.Longitude<-118)]
nhoods.reset_index(inplace=True,drop=True)
If we display the data frame nhoods, we get this:
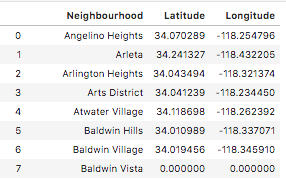 Neighborhoods with Latitude and Longitude
address = 'Los Angeles, USA'

geolocator = Nominatim(user_agent="la_explorer")
location = geolocator.geocode(address)
latitude = location.latitude
longitude = location.longitude
print('The geograpical coordinates of {} are {}, {}.'.format(address,latitude, longitude))

# create map of LA using latitude and longitude values
map_la = folium.Map(location=[latitude, longitude], zoom_start=10)

# add markers to map
for lat, lng, neighbourhood in zip(nhoods['Latitude'], nhoods['Longitude'], nhoods['Neighbourhood']):
    label = '{}'.format(neighbourhood)
    label = folium.Popup(label, parse_html=True)
    folium.CircleMarker(
        [lat, lng],
        radius=3,
        popup=label,
        color='red',
        fill=True,
        fill_color='#3199cc',
        fill_opacity=0.3,
        parse_html=False).add_to(map_la)
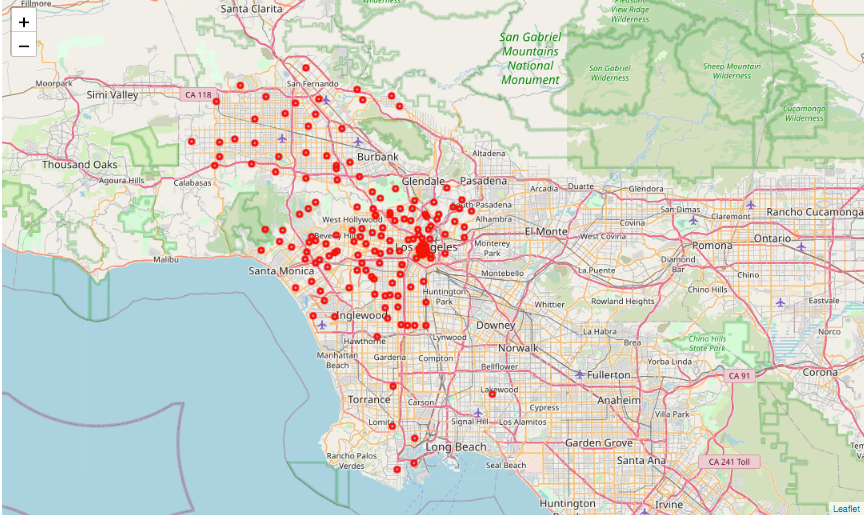 Neighborhoods mapped using Folium
Using the Foursquare API
before we use the API, let’s give a bit into detail about what the API exactly does:
Foursquare itself is a location-based service and tracks check-ins done on social media ( Yes, the twitter and Facebook check-ins at your favorite coffee shop are recorded by Foursquare). Essentially to sum it all it is a very powerful geotagging service with a record of over 62 million venues globally in 190+ countries. If we dive a bit further we can also monitor the activity in venue and the frequency of a type of venue.
In order to use the Places API provided by the company we first have to create a project over here. This gives us the Client ID, **Client Secret **(These should not be shared).
CLIENT_ID = '' # Foursquare ID
CLIENT_SECRET = '' # Foursquare Secret
VERSION = '' # Foursquare API version

print('Your credentails:')
print('CLIENT_ID: ' + CLIENT_ID)
print('CLIENT_SECRET: ' + CLIENT_SECRET)
K-Means Clustering
The first step we’ll take is finding the most optimum value for K using the Silhouette Coefficient Method.
A high Silhouette Coefficient score relates to a model with better-defined clusters.
A higher Silhouette Coefficient indicates that the object is well matched to its own cluster and poorly matched to neighboring clusters.
from sklearn.metrics import silhouette_score

la_grouped_clustering = la_grouped.drop('Neighbourhood', 1)

for n_cluster in range(2, 12):
    kmeans = KMeans(n_clusters=n_cluster).fit(la_grouped_clustering)
    label = kmeans.labels_
    sil_coeff = silhouette_score(la_grouped_clustering, label, metric='euclidean')
    print("For n_clusters={}, The Silhouette Coefficient is {}".format(n_cluster, sil_coeff))


    # set number of clusters
kclusters = 4

la_grouped_clustering = la_grouped.drop('Neighbourhood', 1)

# run k-means clustering
kmeans = KMeans(n_clusters=kclusters, random_state=0).fit(la_grouped_clustering)

# check cluster labels generated for each row in the data frame
kmeans.labels_

# add clustering labels
Neighbourhoods_venues_sorted.insert(0, 'Cluster Label', kmeans.labels_.astype(int))
# Neighbourhoods_venues_sorted['Cluster Label']=kmeans.labels_.astype(int)
la_merged = nhoods

# merge la_grouped with nhoods to add latitude/longitude for each Neighbourhood
la_merged = la_merged.join(Neighbourhoods_venues_sorted.set_index('Neighbourhood'), on='Neighbourhood')
la_merged.dropna(inplace=True)
la_merged['Cluster Label'] = la_merged['Cluster Label'].astype(int)
la_merged.head()
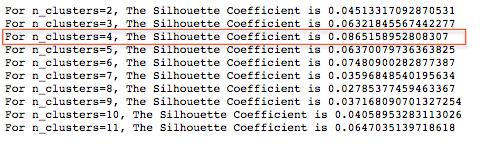 Choosing the best cluster k = 4
As we can see the highest Silhouette Coefficient is when the number of clusters is 4. Therefore we will group our neighborhoods into 4 clusters using K-means clustering.
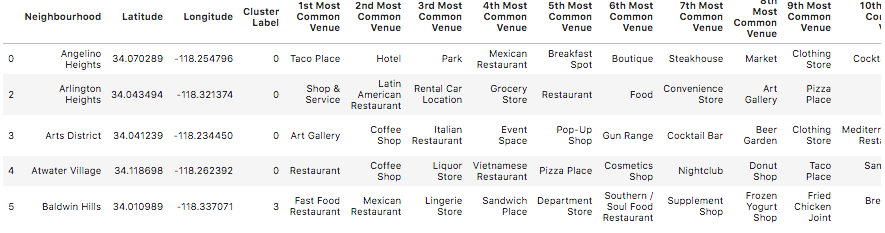
Top 10 venues from each cluster
import matplotlib.colors as colors
from matplotlib.colors import rgb2hex
# create map
map_clusters = folium.Map(location=[latitude, longitude], zoom_start=10)
# set color scheme for the clusters
x = np.arange(kclusters)
ys = [i + x + (i*x)**2 for i in range(kclusters)]
colors_array = cm.rainbow(np.linspace(0, 1, len(ys)))
rainbow = [colors.rgb2hex(i) for i in colors_array]
rainbow[2]='#006000'
rainbow[1]='#006ff6'
# add markers to the map
markers_colors = []
for lat, lon, poi, cluster in zip(la_merged['Latitude'], la_merged['Longitude'], la_merged['Neighbourhood'], la_merged['Cluster Label']):
label = folium.Popup(str(poi) + ' Cluster ' + str(cluster), parse_html=True)
folium.CircleMarker(
[lat, lon],
radius=5,
popup=label,
color=rainbow[cluster-2],
fill=True,
fill_color=rainbow[cluster-2],
fill_opacity=0.7).add_to(map_clusters)
legend_html = '''
<div style="position: fixed;
bottom: 100px; left: 50px; width: 120px; height: 100px;
border:3px solid black; z-index:9999; font-size:13px;
"> Green - Cluster 0 <br>
Red - Cluster 1 <br>
Purple - Cluster 2 <br>
Blue - Cluster 3 </i>
</div>
'''
map_clusters.get_root().html.add_child(folium.Element(legend_html))
map_clusters
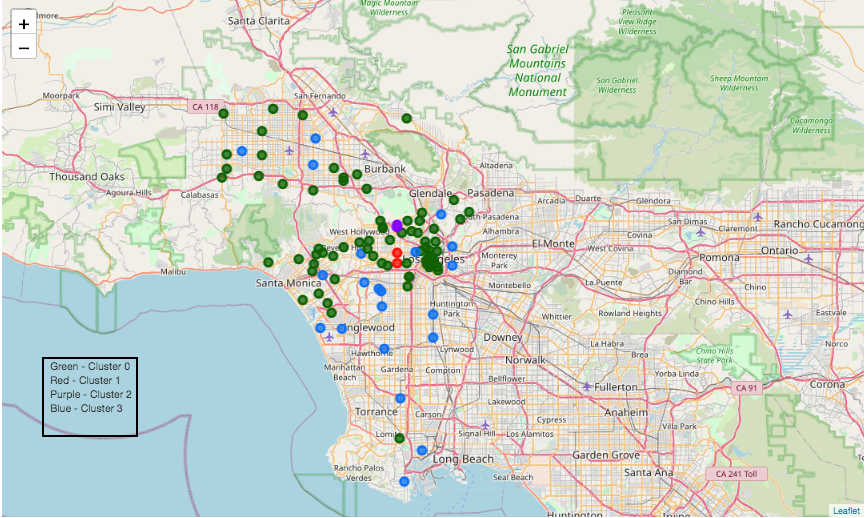 Mapping the clusters (K = 4)
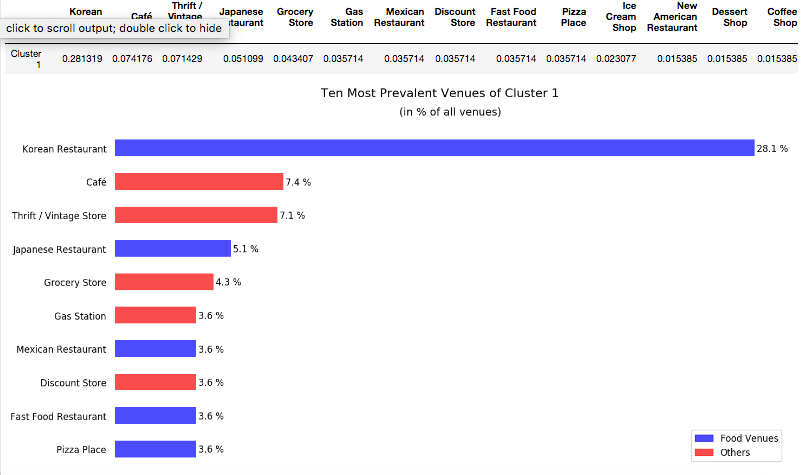
Visualizing the top 10 venues
Next, we will write a function to generate a horizontal bar plot showing the top 10 venues for each cluster, highlighting the food venues:
def generate_plot(clus,i):

    plt.style.use('default')

    tags=['Restaurant','Coffee','Food','Pizza','Sandwich']
    colors = []
    for value in clus.index:
        if  any(t in value for t in tags):
            colors.append('#0000FF')
        else:
            colors.append('#FF0000')

    ax=clus.plot(kind='barh', figsize=(16,8), color=colors, alpha=0.7)

    plt.title('(in % of all venues)\n')
    ax.title.set_fontsize(14)
    plt.suptitle('Ten Most Prevalent Venues of Cluster {}'.format(i), fontsize=16)

    ax.spines['top'].set_visible(False)
    ax.spines['left'].set_visible(False)
    ax.spines['right'].set_visible(False)
    ax.spines['bottom'].set_visible(False)

    plt.xticks([])
    ax.tick_params(axis ='both', which ='both', length = 0)
    labels = [(item.get_text()+'  ') for item in ax.get_yticklabels()]
    ax.set_yticklabels(labels)

    for label in (ax.get_yticklabels()):
        label.set_fontsize(12)

    for index, value in enumerate(clus):
        label = "%.1f " % round(value*100,1) + "%"
        # place text at the end of bar (adding 0.001 to x, and 0.1 from y to make it appear just after the bar)
        plt.annotate(label, xy=(value + 0.001, index - 0.1), color='black',fontsize=12)

    legend_elements = [Patch(facecolor='#0000FF', edgecolor='#0000FF',
                             label='Food Venues',alpha=0.7),
                       Patch(facecolor='#FF0000', edgecolor='#FF0000',
                             label='Others',alpha=0.7)]

    ax.legend(handles=legend_elements, loc='best',fontsize=12)
clus1neigh=la_merged.loc[la_merged['Cluster Label'] == 1, la_merged.columns[0]].values.tolist()


filtered_nhoods=nhoods.copy()

for i in range(0,len(filtered_nhoods)):

    if filtered_nhoods.iloc[i,0] not in clus1neigh:
        filtered_nhoods.iloc[i,0]='TO DROP'

filtered_nhoods=filtered_nhoods[filtered_nhoods.Neighbourhood!='TO DROP']
filtered_nhoods.reset_index(drop=True,inplace=True)

filtered_nhoods
Cluster 1
I’ve added more details about why I chose Cluster 1 compared to the other 3. One of the main reasons for doing so is because it was a safer option than choosing a cluster with a significant % of restaurants or one with barely any.
 Examining Cluster 1
Next well will again use the Foursquare API to locate existing Greek Restaurants in the neighborhoods present in Cluster 1.
In order to find the correct code for the venue refer to this link
def get_neighbourhood_Greek_Restaurant(url1):

    results = requests.get(url1).json()

    # assign relevant part of JSON to venues
    venues = results['response']['venues']

    # tranform venues into a data frame
    dataframe = json_normalize(venues)

    #print('DataFrame',dataframe)
    # keep only columns that include venue name, and anything that is associated with location
    filtered_columns = ['name', 'categories'] + [col for col in dataframe.columns if col.startswith('location.')] + ['id']
    #print('Filtered columns',filtered_columns)
    dataframe_filtered = dataframe.loc[:, filtered_columns]

    # filter the category for each row
    dataframe_filtered['categories'] = dataframe_filtered.apply(get_category_type, axis=1)

    # clean column names by keeping only last term
    dataframe_filtered.columns = [column.split('.')[-1] for column in dataframe_filtered.columns]

    display(dataframe_filtered.loc[:,['name','categories','distance','lat','lng']])


category='4bf58dd8d48988d10e941735'#The category for Greek restaurants obtained from https://developer.foursquare.com/docs/resources/categories
radius = 700
LIMIT=30

for n in range(0,len(filtered_nhoods)):
    url = 'http://api.foursquare.com/v2/venues/search?client_id={}&client_secret={}&ll={},{}&v={}&categoryId={}&radius={}&limit={}'.format(
    CLIENT_ID,
    CLIENT_SECRET,
    filtered_nhoods.iloc[n,1],
    filtered_nhoods.iloc[n,2],
    VERSION,
    category,
    radius,
    LIMIT)
    print('------------------------------------------------- '+ filtered_nhoods.iloc[n,0] + ' -------------------------------------------------')
    get_neighbourhood_Greek_Restaurant(url)
    print('\n\n')
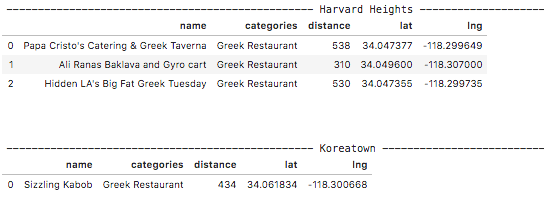 Existing Restaurants in Cluster 1
In this case, We will choose to go with a location that has more Greek Restaurants. This is because the data shows that the population in Harvard Heights is more accustomed to Greek Restaurants and is, therefore, a less risky location.
In terms of choosing the Neighborhood closest to the city center, we can observe that there is not much difference in distance for both Neighborhoods.
filter2_nhoods = filter2_nhoods.reindex( columns = filter2_nhoods.columns.tolist() + ['Distance from LA center (in km)'])  #this way to avoid warnings

from math import radians, sin, cos, acos

slat = radians(34.0536909) #LA center Latitude obtained earlier
slon = radians(-118.2427666) #LA center Longitude obtained earlier

for n in range(0,len(filter2_nhoods)):

    elat = radians(filter2_nhoods.iloc[n,1])
    elon = radians(filter2_nhoods.iloc[n,2])

    dist = 6371.01 * acos(sin(slat)*sin(elat) + cos(slat)*cos(elat)*cos(slon - elon))
    filter2_nhoods.loc[n,'Distance from LA center (in km)']=dist


filter2_nhoods.sort_values(by='Distance from LA center (in km)',inplace=True)
filter2_nhoods.reset_index(drop=True,inplace=True)
filter2_nhoods

The last check is to compare the rent prices. Unfortunately, the dataset available does not contain rent rates for Korea Town.
url = requests.get('https://www.rentcafe.com/average-rent-market-trends/us/ca/los-angeles/').text
soup = BeautifulSoup(url,"html.parser")

table = soup.find('table',id="MarketTrendsAverageRentTable")
pr = table.find_all('td')
nh = table.find_all('th')

price = []
neighbourhood = []

for i in range(0, len(pr)):
    price.append(pr[i].text.strip())
    neighbourhood.append(nh[i+2].text.strip())

df_rent = pd.DataFrame(data=[neighbourhood, price]).transpose()
df_rent.columns = ['Neighbourhood', nh[1].text]


df_rent[(df_rent['Neighbourhood']=='Harvard Heights') | (df_rent['Neighbourhood']=='Korea Town')]

One last step taken to ensure that it is easier for the restaurant to sustain itself was by making sure the rent price in the location is affordable. We did that by scrapping a table [2] containing the average rent of all neighborhoods. Unfortunately, the rent for Korea Town was not included in the database and is yet to be added by the website. However, the rental prices of an area give us a considerable amount of information about the demographics therefore it is useful when planning the setup of the restaurant itself.
If we were to open up an affordable restaurant in a location such as Harvard Heights is a very suitable location as it has one of the lowest rental prices in the county. However, let us assume the client wants to open a restaurant that leans more towards fine dining. In a case like that, it should not be set up in the medium to a low-income neighborhood where it would not perform well. At the same time, a restaurant that operates as casual dining or fast food restaurant would preferably be set up in an area where the rent is low and affordable enough to maintain the restaurant’s finances. This is particularly due to the low price of food.
Conclusion
This project focused on highlighting the basic research needed to find potential neighborhoods to open a Greek restaurant in Los Angeles. It follows a few simple procedures which were, finding neighborhood data of Los Angeles. This can be done by either web scrapping or finding a usable *.json *file. The next step conducted was to obtain the coordinates of the respective neighborhoods using a geolocator and then mapping them over a map of Los Angeles using Folium. Our main instrument in this project was the use of Foursquare API which gives us access to the commercial traffic in the region. Commercial traffic, in this case, is all the venues listed in their respective locations and their frequency.
The API helps us identify hotspots are more occurring more frequently and plan accordingly. Using the Foursquare API we selected the neighborhoods with at least 10 venues and used K-means clustering (K = 4) to further examine our data frame. According to our needs Cluster, 1 was chosen to be the best option. Finally, our neighborhood choices were trimmed down to two neighborhoods, Harvard Heights and Korea Town. We chose Harvard Heights in the end due to three primary reasons:
-
The number of Greek Restaurants was more in Harvard Heights was 3 times more than in Korea Town. Therefore, it can be considered a safe option.
-
The distance is approximately 6 km from the City Center.
-
The rent price in Harvard Heights is cheaper in comparison to most neighborhoods.
Realistic Constraints
It is important to note that the location of the restaurant was solely done by choosing 3 very simple factors and serve as a point on the road map towards opening a restaurant. In reality, there are many more factors to consider minimizing risk. These include:
-
Population Density of the area
-
The availability of lot that matches our required size
-
The budget of the restaurant itself.
-
Safety and crime record of the area.
-
Public transport around the location.
Thank you
For further information, you can refer to the GitHub repository and the Gists for this exercise.
Note: This article is a capstone project and is part of the Coursera IBM Data Science Certification.